


In a 2020 statement about public school budgets, “over 500 of the top education experts in the U.S.” declared:
Research is abundantly clear that money matters for student achievement and other important life outcomes, and this is especially the case for low-income students.
Recent research from the Brookings Institution bulldozes that assertion. Conducted by PhD economist Sarah Reber and predoctoral fellow Gabriela Goodman, the research examined the latest data before the steep declines in student achievement since the Covid-19 school closures and found that:
- “substantial increases in per-pupil spending over time have often been met with stagnant academic achievement.”
- “school spending in some states is more than twice that in others, yet average per-pupil spending is only weakly related to test scores and graduation rates.”
- “economically disadvantaged students in higher-spending states don’t achieve better outcomes compared to their counterparts in lower-spending states.”
The study’s authors often present their results in scholarly measures like standard deviations, but they published one very revealing chart that is crystal clear. It plots the average per-pupil spending in each state versus the average test scores for disadvantaged and non-disadvantaged students:
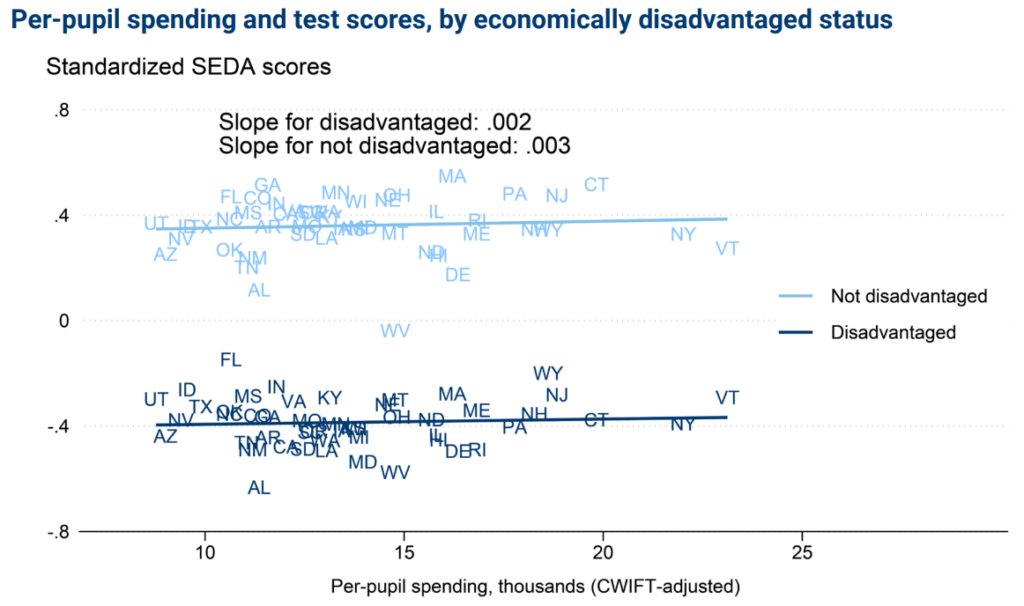
The chart above shows large variations in spending between the states but no clear pattern of test scores and a barely detectable overall association. Moreover, the full association is even less perceptible because the authors excluded New York from the trend lines because it is a “high-spending, low-outcome outlier.”
The power of this chart is that it displays both disadvantaged and non-disadvantaged students. Plotting these groups in isolation can make tiny differences in test scores appear substantial by simply zooming up on them, thus masking the big picture.
In opposition to the “top education experts” who declare that higher spending is “especially” helpful for “low-income students,” the study found:
Economically disadvantaged students in high-spending states are exposed to much higher levels of school spending, but they do not have better test scores. To take one example, average spending in Texas was about $10,000, compared to around $18,000 in Pennsylvania or New Hampshire, but average scores for economically disadvantaged students in all three states are similar.
Because association does not prove causation, no observational study can accurately measure the effects of increased education spending. However, these results plainly show that doubling and tripling spending is either ineffective or so completely overwhelmed by other factors that it fails to create a visible pattern across all 50 states.
Like all social science studies, this one has limitations, but as documented below, the study is methodologically sounder than those cited by the “top education experts.”
The main weakness of the study is that the authors haven’t published their raw data or responded to Just Facts’ requests for the data. This is a red flag that they may be hiding something.
Spending & Performance Trends
Contrary to a drumbeat of media stories decrying funding cuts to K–12 schools, the national average inflation-adjusted spending per public school student has risen by 25 times since 1920:
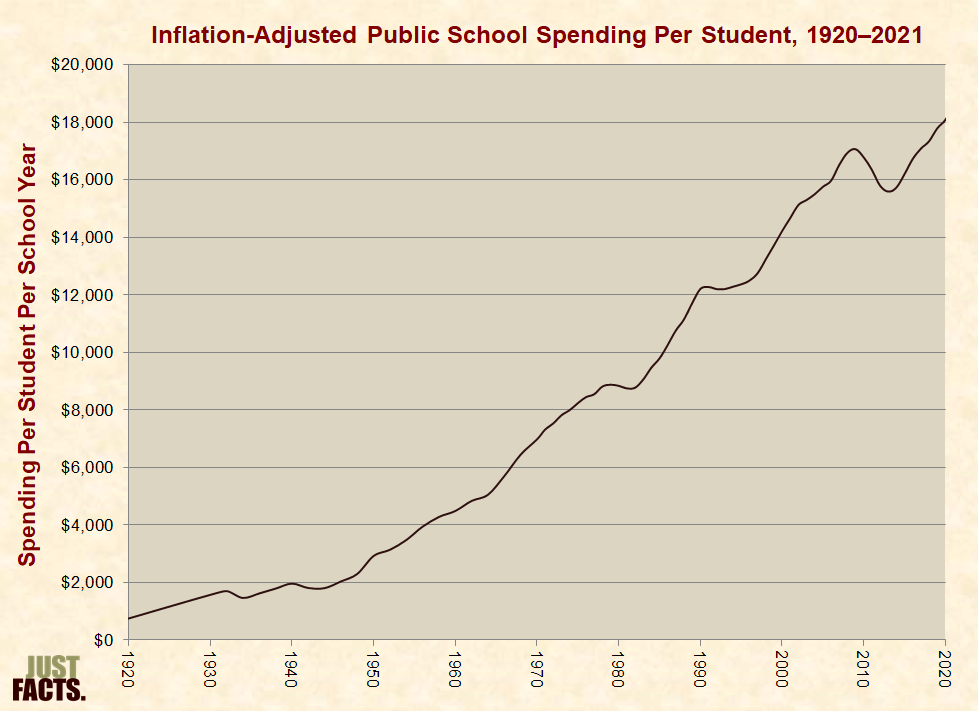
According to the latest data from the U.S. Department of Education, governments spent an average of $18,614 for every student enrolled in public K-12 schools during the 2020–21 school year. Furthermore, this figure omits three significant categories of education expenses:
- State government administration
- Unfunded pension liabilities for government employees
- Post-employment non-pension benefits (like health insurance)
Recent scientific surveys show that Americans vastly underestimate how much money is spent on public schools.
For example, a survey commissioned in 2021 by the journal Education Next and the Kennedy School of Government at Harvard University found that U.S. adults on average estimate that their local public schools spend $8,719 per student each year. This was less than half of the real amount.
Similarly, a survey commissioned by Just Facts in 2019 found that 53% of voters thought the average spending per public school classroom was less than $150,000 per year. At the time, the actual figure was about $313,000, or more than twice what most people believed.
Although these figures are averages, they are also indicative of school districts with large populations of minorities and poor students.
Since the early 1970s, school districts with high portions of minority pupils have spent about the same amount per student as other districts. This is shown by a broad range of studies conducted by the left-leaning Urban Institute, the conservative Heritage Foundation, Ph.D. economist Derek Neal, and the U.S. Department of Education.
Likewise, a study published in 2025 by Education Next found that school districts with high portions of poor students spend about 2.5% more per pupil than other districts and have done so since at least 1994.
From the time that the U.S. Department of Education was founded in 1979, the average inflation-adjusted spending per public school student has more than doubled.
Yet, the national average math and reading scores for 17-year olds in the National Assessment of Educational Progress haven’t increased over this period and may even have fallen because:
- assessments on 17-year-olds haven’t been conducted since 2012.
- younger students experienced substantial declines in math and reading over recent years, particularly in the wake of school closures and other ill-informed reactions to the Covid-19 pandemic.
In short, comprehensive measures show no indication that large expansions of public school spending have improved student performance.
Opposing Studies
The 500 “top education experts” who allege that “money matters” use four hyperlinks to support that claim. Three of the links lead to the same study, and all them cite the work of the same lead author: Northwestern University professor and PhD economist Kirabo Jackson.
The Brookings Institution study repeatedly notes that its findings are at odds with a 2024 meta-analysis coauthored by Jackson. The Brookings scholars state that some of this disconnect may be due to the fact that “most of the studies” in Jackson’s meta-analysis are “based on older data,” but there are deeper issues.
Jay P. Greene, a PhD who specializes in education research, authored a 50-page analysis of Jackson’s research on school spending and found a “number of serious flaws” in his “evidence and arguments,” including but not limited to the following:
- Jackson’s work is “riddled with errors, inconsistencies, and ambiguities….”
- One of his key studies is “not robust to reasonable changes in model specification, data source, or outcome selection.”
- Jackson’s meta-analyses are “not based on a complete and unbiased set of studies.”
- He “claims” to “‘employ quasi-experimental methods to isolate causal impacts’,” but the studies he uses don’t actually do that.
Greene summarizes Jackson’s work by describing it as “unscientific” and more akin to “advocacy than expert opinion.”
Conclusion
The performance of K–12 schools has major consequences for the well-being of children, as well as the fabric of the nation. The father of the U.S. public education system, Horace Mann, was well aware of these stakes. In 1841, he declared that public schools are “the greatest discovery ever made by man,” and if they were “worked with the efficiency” of which they are capable:
nine tenths of the crimes in the penal code would become obsolete; the long catalogue of human ills would be abridged; men would walk more safely by day; every pillow would be more inviolable by night; property, life, and character held by a stronger tenure; all rational hopes respecting the future brightened.
Reality has played out very differently than Mann predicted. Even though inflation-adjusted spending per public school student has risen by about 41 times since 1885, and public schools are now spending an average of about $376,000 per classroom per year:
- only 37% of U.S. residents aged 16 and older can correctly answer a question that requires basic logic, addition, and division.
- only 20% of the college-bound high school students who take the ACT exam meet its college readiness benchmarks in all four subjects (English, reading, math, and science).
- two-thirds to three-quarters of all young adults in the U.S. are unqualified for military service because of poor physical fitness, weak educational skills, illegal drug use, medical conditions, or criminal records.
- 15-year-old U.S. students rank 31st among 37 developed nations in math, even though the U.S. spends an average of 31% more per K-12 student than other developed nations.
Public schools cannot be logically blamed for the entirety of those outcomes, but they undoubtedly play a significant role in them. This is because they are among the central competencies that schools purport to instill, and K–12 students spend more time in school each year than any other single waking activity over these formative years of their lives.
Exploding the mantra that more funding is needed, recent research and decades of data show that multiplicative increases in public school spending have failed to substantially help children.
James D. Agresti is the president of Just Facts, a research and educational institute dedicated to publishing facts about public policies and teaching research skills.


