


Natalie Winters gives statistical analysis of state vote dumps in the 2020 presidential election in this special Vote Dumps Report.
Involved in the collaboration of statistical vote analysis to produce these reports is work by Eric Quinnell (Engineer); Stan Young (Statistician); Tony Cox (Statistician); Tom Davis (IT Expert);Ray Blehar (Government Analyst, ret’d); John Droz (Physicist);and Anonymous Expert.
Executive Overview
A team of unpaid citizen volunteer mathematicians, scientists, IT veterans, and engineers collaborated in a statistical vote analyses of selected states in the 2020 Elections. The purpose of such an analysis is not to tell what happened (ballot stuffing, machine algorithm, etc.), but rather where there were unusual results.
In this special report we are looking at what has been called vote “Dumps.” We are defining a Dump as unusually large differentials between Presidential candidates, received/recorded at one time. We looked for such influxes for both candidates. The conclusion is that all we were able to find were net Biden Dumps (see next page, Table 1, where the states are listed alphabetically, and the dumps chronologically). Note that we simply did not have the time to examine the results of all 50 states. These are representative. Unless otherwise noted, all data on Table 1 are from Edison time-series analysis of rates of votes added.
Again, we cannot determine exactly what happened to cause these Dumps (e.g., ballot stuffing, something legitimate, etc.), but rather where (a State) and time(s) that these unusual results took place.
To verify vote integrity, Phase 2 is to have a forensic audit done of the locations and time(s) where these suspicious Dumps were identified— which can likely resolve the what. For any questions, please contact one of the above listed authors.
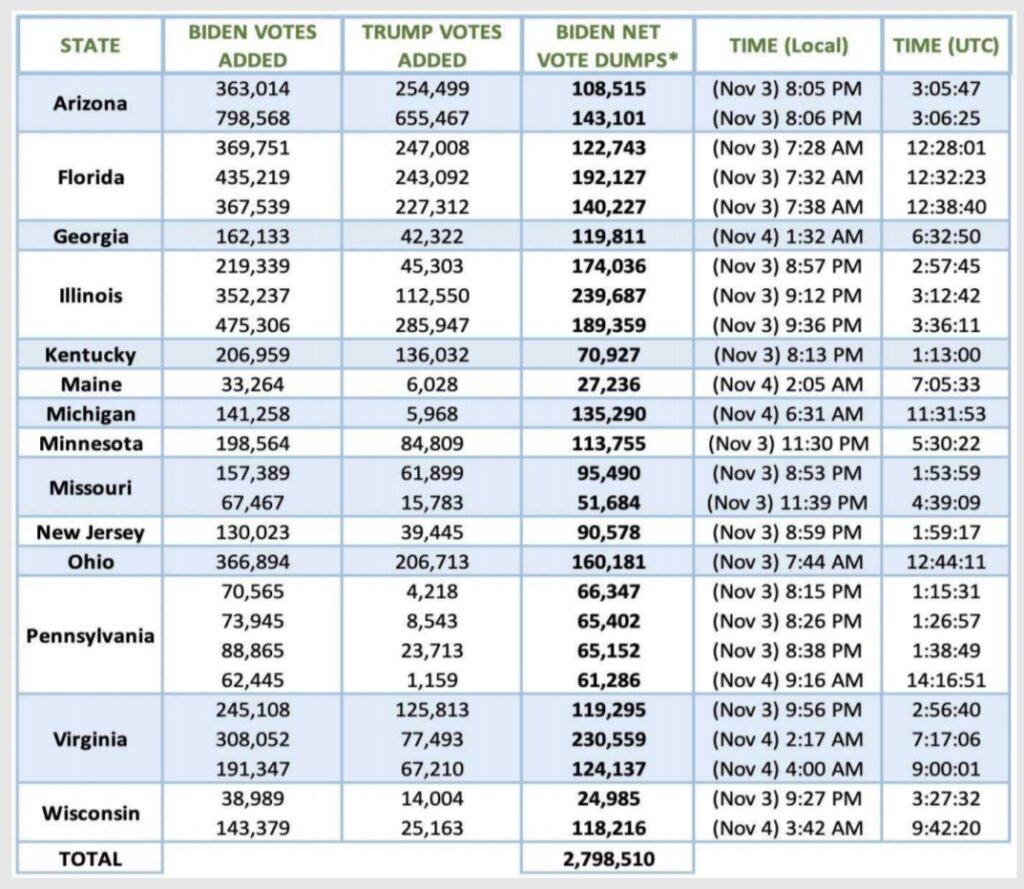
*A “Net Vote Dump” for most of the above states is defined as a 25,000+ vote differential between 2020 Presidential candidates, at one time. All were for Biden as we were not able to find any cases for Trump that met this criteria. (If any can be documented, we’d be glad to do an update and include them.)
AZ, PA & VA are exceptions for our arbitrary 25k rule. PA and VA (unlike most other states) have too many
over 25k. AZ has just two standouts. As a result, the PA threshold is 60k and AZ & VA are 100k.
Note: there are major differences with various versions of the Edison data — and it’s not always clear as to which are the most reliable. Table 1 was made up from versions 11-24 and 11-25 Edison data, and we did our best to sort through confusing data… Also note that all of the timestamps in this report are 2020.
Appendix
Author: John Droz, Jr.
Some other 2020 election reports, etc. our team of independent experts have put together are:
A Pennsylvania Report,
A Michigan Report,
A Claudia Tenney Report (NY-22),
Other reports on Georgia, Wisconsin, etc.
Since the media hasn’t done a good job of publicizing material they consider “contrarian,” we often get asked: what are some other quality 2020 election-related reports? Although we haven’t done exhaustive research on other reports, here are some of our favorites:
1 – The Nevada Report by attorney Jesse Binnall.
2 – The Antrim Michigan (Dominion) Report done by Russ Ramsland.
3 – The Immaculate Deception Report by Peter Navarro.
4 – A study on absentee ballots by Dr. John Lott.
5 – A Judicial Watch Study that concluded that 353 US counties have more registered voters than people
eligible to vote.
6 – Here are interesting compendiums of 2020 election-related actions and claims: here, here, and here.
There is a substantial amount of concrete information in those collections.
7 – A post-Electoral College commentary: When Will the Fat Lady Sing? by John Droz.
8 – Lastly you might want to do searches over the Energy and Environmental Newsletter 2020 archives,
where over a hundred articles and reports about the election situation are referenced.
If you are aware any other quality 2020 election studies and reports, feel free to email us here.
Lastly, here is the bottom line, where we compare the data on Table 1 to the reported Biden lead for some key swing states. We’ve also listed the Electoral College votes for each state (270 are needed to win).
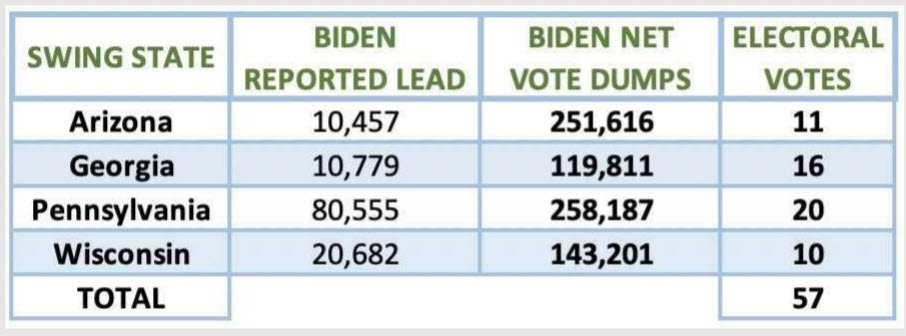
Note 1: The current Electoral College votes are: Biden = 306 and Trump = 232.
Note 2: If any three of the above state’s Electoral College votes are changed to accurately reflect the public’s actual votes, the new totals would put Trump in a tie, or over 270.


