


The nation’s fiscal and economic outlook has deteriorated substantially since the last Congressional Budget Office (CBO) baseline in May of this year, when CBO projected debt would reach a record 110 percent of Gross Domestic Product (GDP) by 2032.
After the Biden administration racked up over $1 trillion in debt in the first half of fiscal 2023, the Congressional Budget Office estimates the national debt will increase by $19 trillion over the next decade under current law, $3 trillion more than it projected last May.
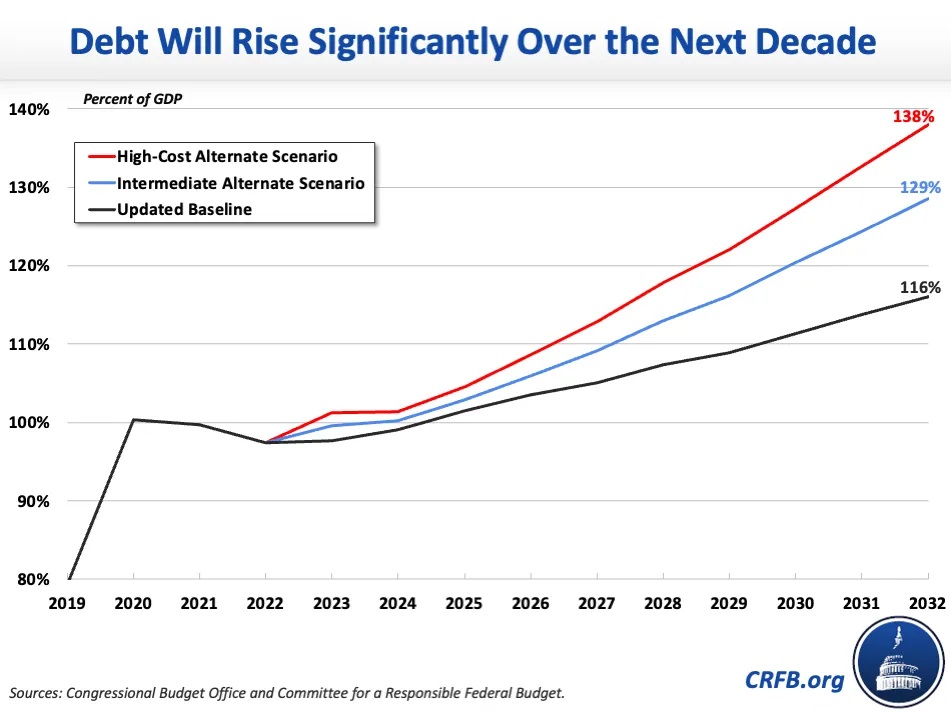
Under an updated current law baseline, we now project debt in 2032 will reach 116 percent of GDP, deficits will reach 6.6 percent of GDP, and interest will reach a record 3.4 percent of GDP. Under a more pessimistic (and in many ways realistic) scenario, debt in 2032 would reach 138 percent of GDP, deficits would reach 10.1 percent, and interest would total 4.4 percent of GDP. These projections suggest an unsustainable fiscal trajectory. See these new projection scenarios in the chart below and learn more here.
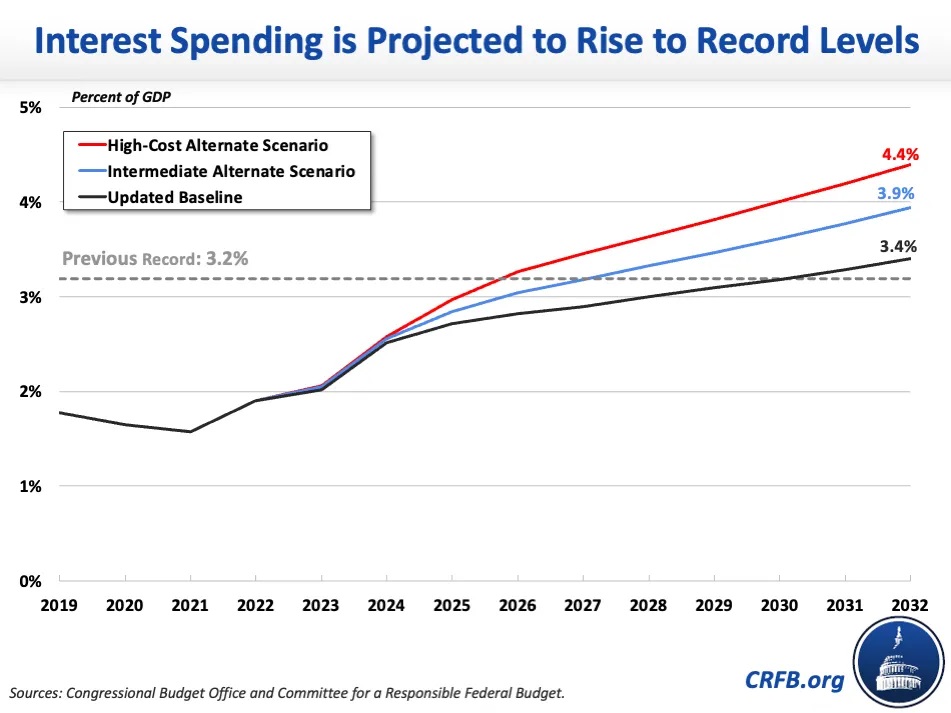
As a share of the economy, interest costs would be in uncharted territory. In all of American history, federal interest costs have never exceeded 3.2 percent of GDP. Estimates now project interest costs will reach 3.4 percent of GDP by 2032 under our baseline scenario, 3.9 percent under the intermediate alternate scenario, and 4.4 percent under the high-cost alternate scenario. Of course, this assumes no further inflation-fighting aggressive interest rates from the Fed.
Looking at the raw US deficit numbers below, one can extend the current Fed chart out ten years to see what the national debt looks like in 2033 – over $50 trillion.
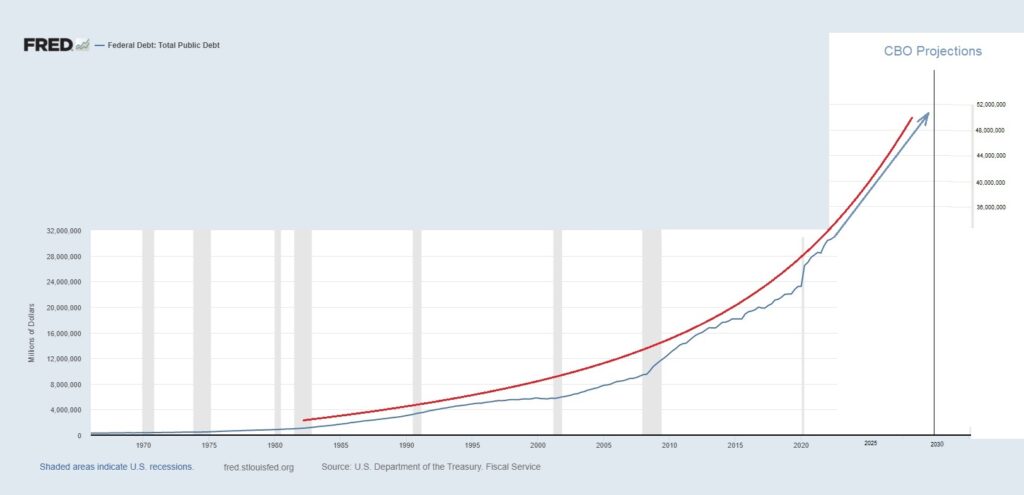
Notice the red line in the above chart – it is an arc indicating that the current phenomenon is exponential. In mathematics, it is called an exponential curve. The exponential function is a mathematical function denoted by f(x) = ax, which means as time goes on, the situation gets worse. But understand that the current arc curve can get steeper if the CBO keeps making “sooner than expected’ adjustments to US fiscal policies done by our politicians.
Remember the legend of Payasam at Ambalappuzha? The king made a deal with the traveling sage that the king thought was good – at least in the short run. It goes something like this – for my payment, give me one grain of rice on the first square of this chessboard, then two grains on the second square, four grains on the third square, eight grains on the fourth square, and so on, so that each square contains double the amount of rice of the previous square.

The total number of grains of rice needed to fill the chessboard would have been 18 quintillion grains of rice, which would weigh approximately 210 billion tonnes and would be enough rice to cover the entire country of India with a meter-high layer of rice. Obviously, the king did not understand the math, and the scheme was not hidden – it was in plain sight.
The point of the legend of Payasam at Ambalappuzha is that the US deficit is in the same pyramidal game – everyone knows it but refuses to do anything about it. And a Great Reset will occur at some point along the arc’s curvature.
See more Chart of the Day posts.
By Tom Williams


