


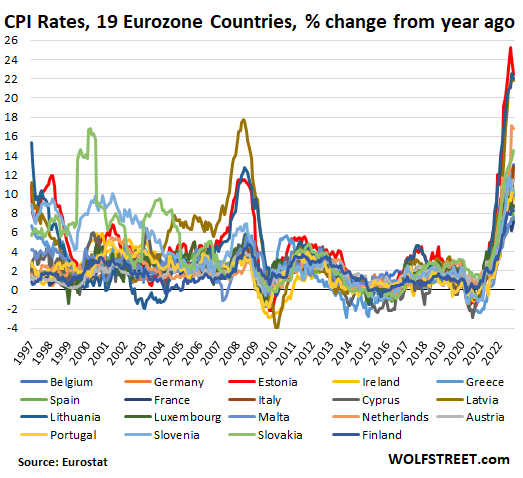
The overall 2022 inflation rate in the 19 countries that use the Euro jumped to 10.7% in October, up from 9.9% in September, by far the worst in the history of the Eurozone data going back to 1997, driven by energy, food, non-energy industrial goods, and increasingly services, according to Eurostat today.
Compared with the prior month, inflation spiked by 1.5%; on an annualized basis, that’s close to 20%! Christine Lagarde, president of the ECB – the very entity that is in charge of this disaster – came out and said in an interview on Irish broadcaster RTE that “defeating inflation is our mantra, our mission, our mandate.” See this in the chart below of the inflation rate in the 19 Eurozone countries and learn more here.
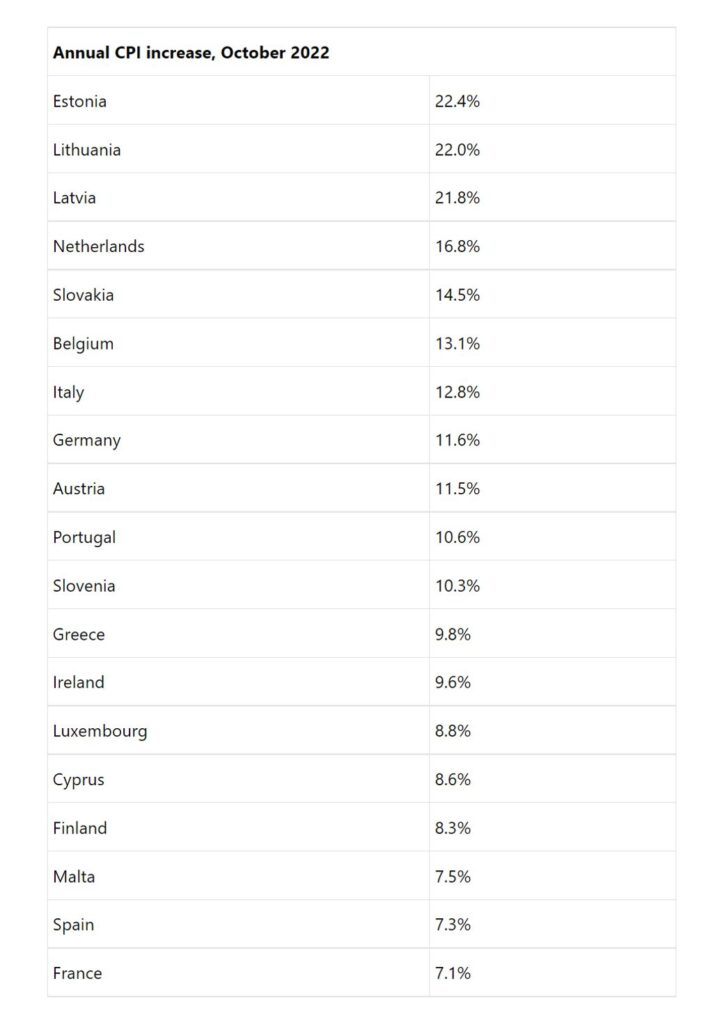
The table below shows the inflation rate of each of the 19 Eurozone member states.
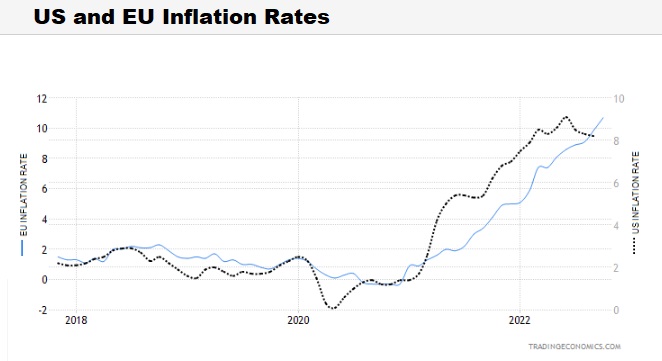
For those stateside, perhaps you may think that this is of no concern. But when comparing the inflation rates with the US and EU, they are pretty much in lockstep – indicating similar economic models and hence useful to compare.
See this comparison in the chart below – noting the trend is the same but notice the “Y” axis in the chart below is different for the two statistics. The EU is marginally worse, but the US inflation is starting to wane relative to the EU.
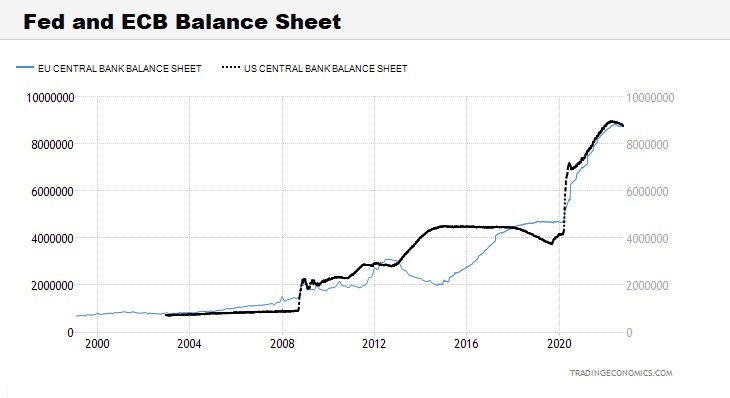
Both the Fed and the ECB have similar amounts of debt on their balance sheets, just over $8tr. But when looking at the GDP of each of the areas in context, the US has a $23tr economy, and the EU has a $16.6tr economy. Hence, the EU is far worse off. See this in the chart below.
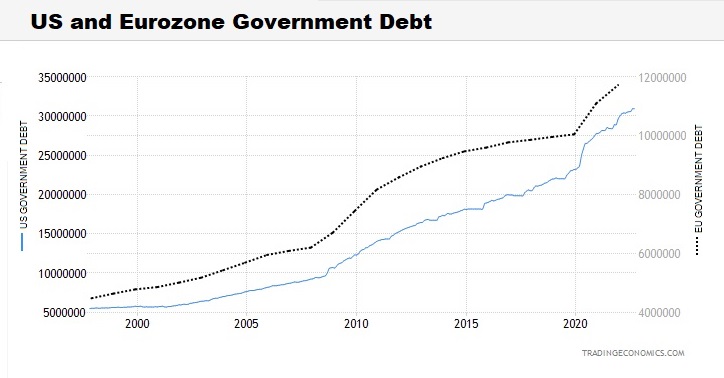
When looking at the EU vs. US government debt, it is shockingly quite different. As bad as the nearly $31tr government US government debt is, the EU member states are closing in on $12tr. See this in the chart below, noting the “Y” axis difference again.
Both areas have started to take action to fight the 40-year high inflation rates in a similar fashion – raise interest rates and begin to unravel their stimulative balance sheets (as seen in the above chart) via quantitative tightening.
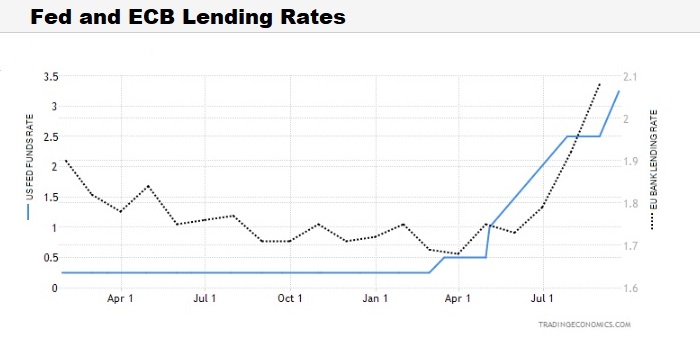
Many have said the Fed has been slow to the game and has just recently started to raise interest rates. But the ECB has been even slower. Central bank lending rates are 3.25% in the US, while the EU is still lower at nearly 2%. See this in the chart below, noting the “Y” axis difference again.
As mentioned before, these economic data points show the similarity in monetary policies of the Fed and the ECB – most central banks in the Western world tend to act in unison in our global economy.
All fiat currencies are falling in value in Western economies (i.e., inflation). It is just that the US Dollar is the cleanest shirt in the laundry relative to other Western currencies – for the moment. Europe’s ECB has not been as aggressive in wanting to fight inflation as the Fed. If interest rates remain high in the US, interest rates lag in the EU, coupled with geopolitical risks in Ukraine, the Euro risks falling even further.
Nevertheless, both economies (the US and the EU) will not be able to sustain these high-interest rates without a severe recession that will be global. Alternatively, the Fed and, subsequently, the ECB will halt and even reverse their current interest rate hike cycles (the Fed Pivot). This latter strategy will merely accelerate the already 40-year high inflation problem both the US and EU have. Both are in the sinking boat together.
There are simply no good solutions, and hence a Great Reset will likely happen regardless of what central banks do.


