


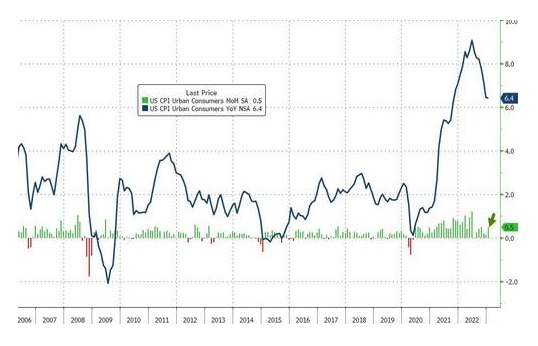
The consensus forecast for the Consumer Price Index (CPI) was for +0.5% MoM in January, and that is what was reported despite hopes for better numbers. If you carry the numbers out to an extra decimal point on a YoY basis, the CPI would be 6.41%, down from 6.45% from the previous month. Hence, US inflation still remains at sticky highs. See this in the chart below and learn more here.
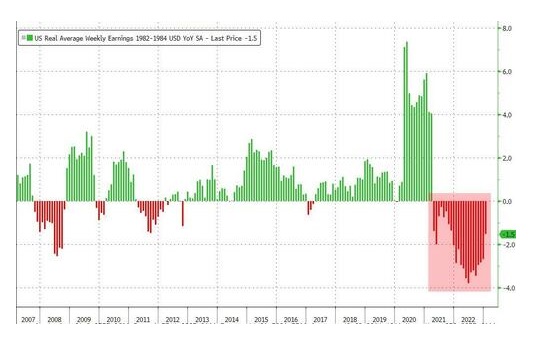
The rise in Americans’ cost of living outpaced their income gains for the 22nd month in a row (weekly earnings -1.5% YoY). See this in the chart below.
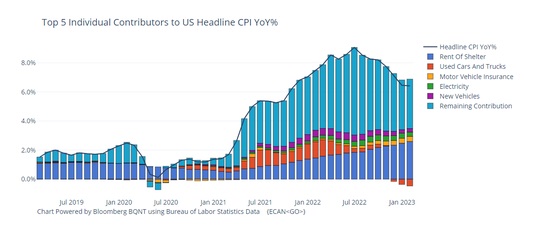
These are the Top 5 contributors to headline CPI (rising shelter costs stand out). See here the actual report from the BLS, which gives a further breakdown.
It should be noted that prior to this inflation report, the BLS made its annual revisions. They made huge CPI revisions. If you thought prices were rising faster than the BLS said, you were right – learn more here and here.
So where do we go from here concerning forecast inflation?
If prices stay at current levels over time, MoM (month on month) and YoY (year on year) will eventually go to zero. But that would mean prices would not come down – they merely will not be continuing to advance. So let’s take a look at where we go from here by looking at our Money Value formula.
The two key determinates of how the value of money is doing are GDP and the Monetary Base of the currency regime. Monetary Base can be grown or shrunk via Central Bank policy (amount of money printing, i.e., currency debasement) and government fiscal policy. Inflation is a by-product of Money Value. Below is a simplified formula to understand Money Value.
Money Value = GDP / Monetary Base
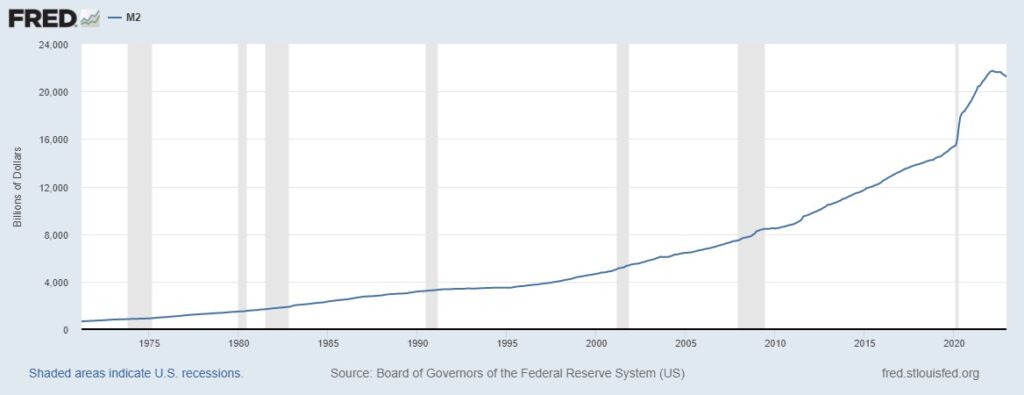
Let’s look at the denominator of this formula – the Monetary Base. It is marginally starting to cool off. See the Fed’s Monetary Base M2 measure in the chart below and learn more here.
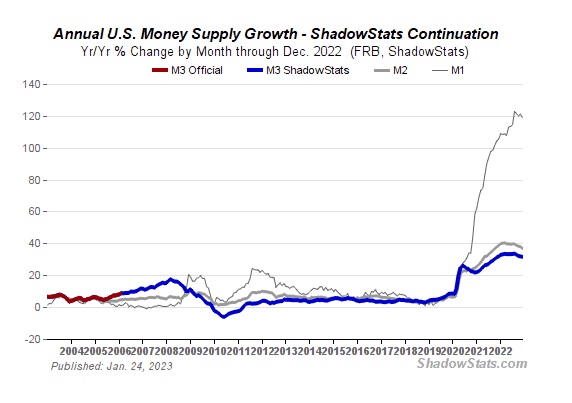
Looking at alternative data, we can see this slight decline in the Monetary Base as well. See this in the chart below and learn more here.
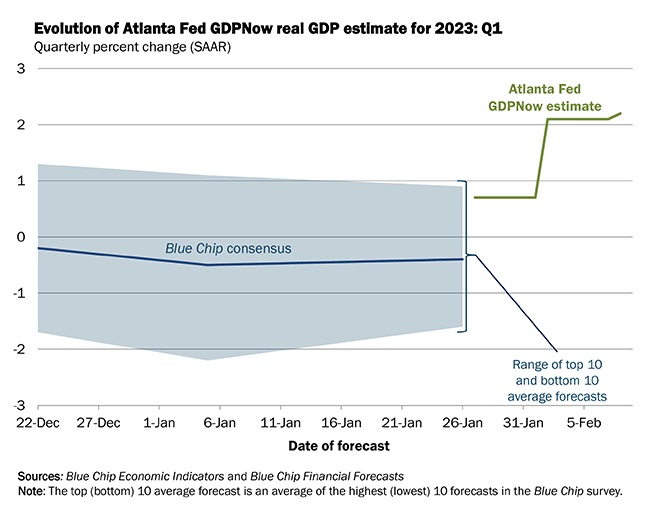
Let’s also look at the numerator of this formula – GDP. Most forecasters show the GDP is near zero to slightly negative growth. See this in the chart below and learn more here.
This means that the current trend shows that prices will level out at current levels, and the economy will have zero growth. However, though the current job numbers are not horrible today, they are beginning to trend down. Other indicators, such as real estate, retail sales, PMIs, and trade balance, to name a few, are also trending down. This current stagnant economy has largely been engineered by Fed policy (higher interest rates and quantitative tightening) to cover up much of the Biden administration’s poor economic performance.
As the economy continues to sink in the first half of 2023, the Fed will be forced to pivot and reverse its current policy at some point. The alternative will be a stagnant economy heading to a recession – perhaps a deep recession. How deep the recession will be dependent on how soon the Fed pivots. The point is that the Fed (government control) is what is driving the economy – and it is a largely political decision. Below is a fairly good summary video of what is happening to the global economy.
Inflation is still very much a part of our economy. It lurks just below the surface. The more politically expedient move will be to print even more money, as many governments have done in history.
Hence, this author believes that the next Fed move will be to pivot and turn back on the printing presses and expand the Monetary Base even further. Inflation starting at a rate that is at a higher level (i.e., the slope of increases that can go exponential) will make the next surge in inflation go even higher in 2023 than it did in 2022.
Put your seat belts on …


