


A Belgian man recently reportedly ended his life following a six-week-long conversation about the climate crisis with an artificial intelligence (AI) chatbot.
According to his widow, who chose to remain anonymous, *Pierre – not the man’s real name – became extremely eco-anxious when he found refuge in Eliza, an AI chatbot on an app called Chai. Eliza consequently encouraged him to put an end to his life after he proposed sacrificing himself to save the planet.
Aside from the insanity of this story, or even if the climate change narrative is scientifically rational, is the world ready or even capable of moving off of carbon-based fossil fuels any time soon in a meaningful way (such as wind and solar energy)?
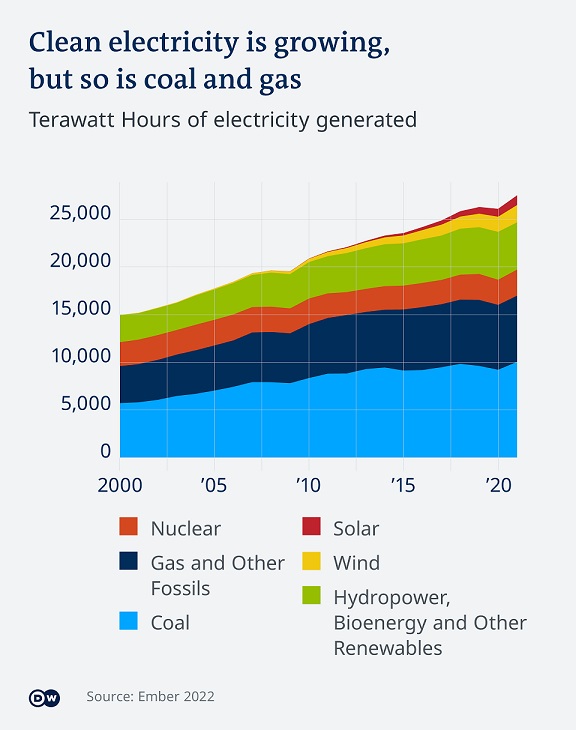
Most electricity is made from coal, the dirtiest source of energy, and fossil gas, which is cleaner but still polluting. The share of renewable energy in the global electricity mix has risen rapidly in the last decade, while the share of nuclear has fallen. The amount of fossil fuels in the mix has remained steady. Wind and solar generated 10% of global electricity in 2021. See this in the chart below and learn more here.
Has anyone looked at a map and made a reasonable assessment that it is even possible to move our energy sources to renewables – solar and wind? We present an analysis from Peter Zeihan that suggest the idea, in practical terms, is not based on reality.
In the following maps, an analysis was made of what geographic areas of the globe would be suitable for wind and solar energy renewables. The areas in red make environmental and economic sense. Areas in orange may make environmental sense but not economic sense. Other colors make little sense environmentally or economically and probably add to carbon emissions and not reducing them.
Below is a global map for solar potential – learn more here.
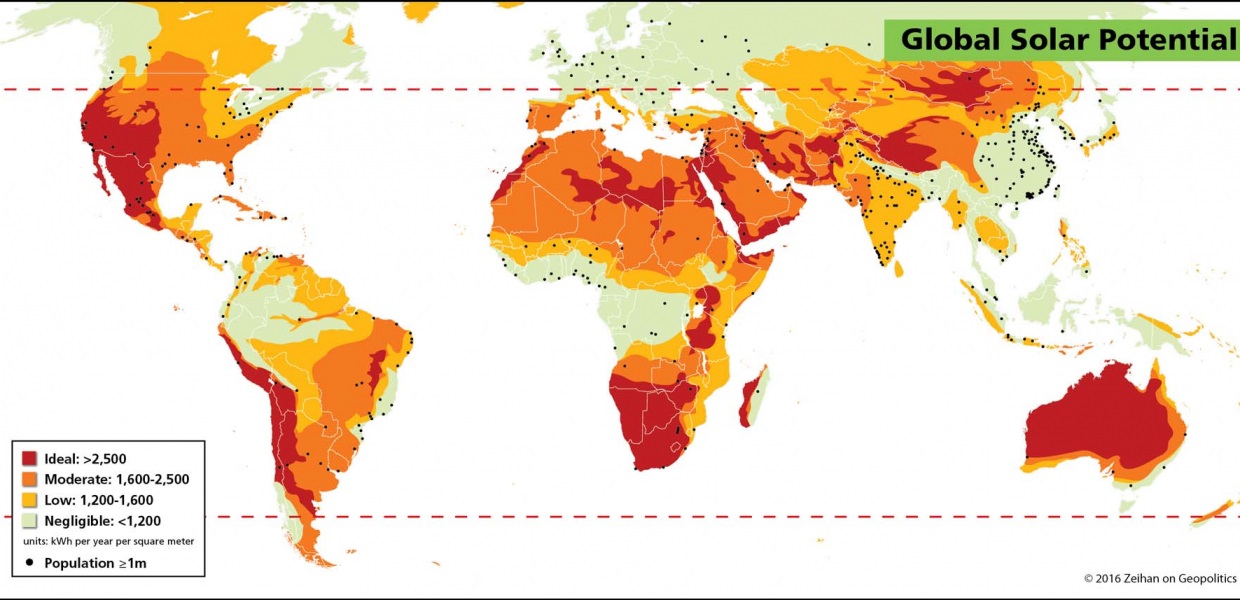
Below is a global map for solar potential – learn more here.
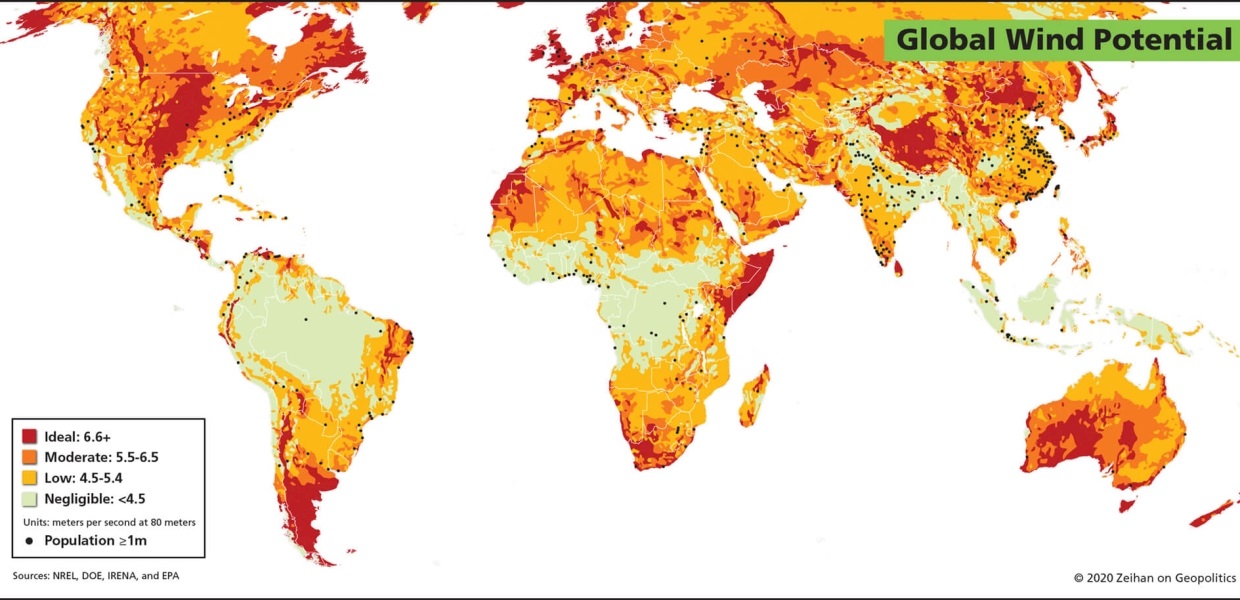
Peter Zeihan asserts that, when calculating for all factors (i.e., appropriate land use, geography, and power distribution), less than 5% of the global land mass is suitable for wind and solar power. Below is a video that goes into further details.
We have heard of “peak oil.” Peak oil is the hypothetical point in time when the maximum rate of global oil production is reached. Given this reality analysis of where wind and solar power could be generated, would it be appropriate to begin discussing peak wind and solar?
The reality is that if mankind really wants to move to cleaner energy, new technology will be required. Investments in solar and wind may turn out to be poor investments in the future. Give us your take in the comment section below.
See more Chart of the Day posts.
By Tom Williams


