


The Gini index is a statistic that measures the socioeconomic conditions of a country, state, city, or social group, and highlights any disparities that “require” policy interventions. It’s supposed to be a measure of income or wealth inequality. Its value ranges from 0 to 100, where 0 indicates perfect equality (everyone has the same income/wealth) and 100 indicates extreme inequality (one person has all the income/wealth). The higher the index value, the greater the disparity between the richest and poorest individuals being studied.
Developed by Italian statistician Corrado Gini in 1912, the index’s value represents, in a single figure, how unequal income/wealth is distributed.
The index is cited in research regarding taxation, welfare policies, and economic reforms. Advocates suggest policies based upon index values that lead to strategies for reducing inequality.
The index purports to quantify the concentration of wealth/income by providing insights into areas for potential reform. The value is supposed to capture the essence of diversity and disparity of income/wealth in one glance. This characteristic is important to the MSM, is featured in media reports and analyses. It’s often referenced in articles and studies that discuss economic trends, policy implications, and social issues related to income/wealth distribution. For example, this Medium article illustrates how the MSM reports the Gini index: “The current era has seen inequality reach historic extremes, with the Gini Index approaching 0.49 - levels that economists associate with social instability and democratic breakdown.”
The Gini index formula is:
(GI) = A / (A + B)
Where:
A = Area between the line of perfect equality and a Lorenz curve
B = Total area under the line of perfect equality
This formula requires a Lorenz curve in order to calculate values for A and B.
A Lorenz curve is a graphical representation used in economics to illustrate the distribution of income/ wealth within a population being studied. Developed by economist Max O. Lorenz in 1905, it plots the cumulative share of income received by each segment of the population against the corresponding cumulative share of the population.
The curve’s value is the ratio of the area A between the line of income/wealth equality to the total area under the line of equality (area A + area B). Thus, the closer the Lorenz curve is to the line of equality, the lower the Gini index value. The curve (illustrated below) helps visualize income/wealth inequality.
Lorenz curve development: The picture on the left presents the income histograms used to create the curve. The picture on the right depicts the actual Lorenz curve [the heavy black line] which is formed by the end-points of the ten cumulative income histograms. The areas ‘A’ and ‘B’ are identified.
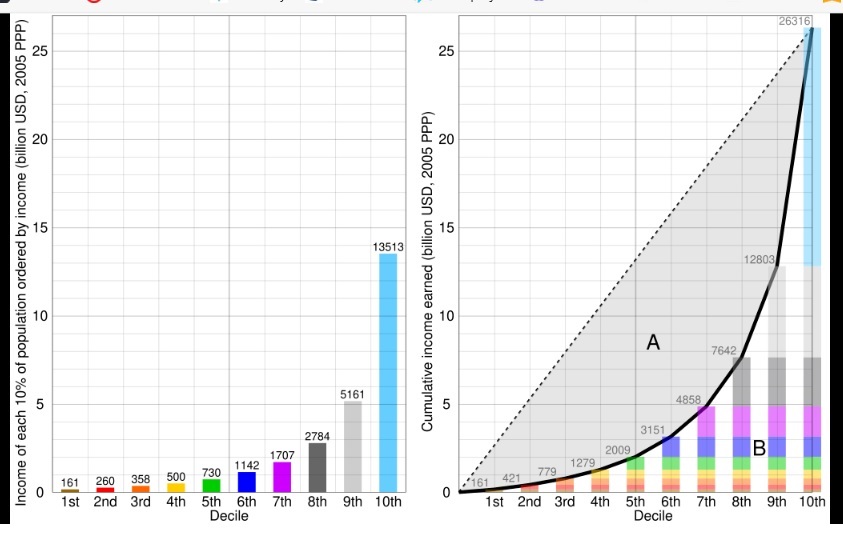
Lorenz curve analysis has notable limitations. The curve considers only income, resulting in an incomplete assessment. Social dynamics, such as cultural norms and biases, are ignored. It oversimplifies complex issues. The primary criticism is that the analysis assumes an ordinal scale for income/wealth distributions when it places income/wealth onto histograms. Ordinal data are data that can be ordered, but precise differences between the ranks aren’t expressed. Histograms represent ordinal data by displaying the frequency of categories along a number line. A cumulative chart shows multiple ordinal categories within a single bar, with each segment of the bar representing a different category, stacked one on top of another. This is precisely what the Lorenz curve deviation does. Examine the creation of the curve – for example, the seventh decile income histogram is ranked to the right of the sixth decile [left picture], but only frequencies are given. Then the seventh decile histogram is stacked on top of the sixth [right picture]. The curve is derived using all histograms, and A and B are calculated.
Limitations of the Lorenz curve derivation apply directly to the Gini index calculation. The index formula has a ‘+’ and a ‘/’ in it. Any data measured on an ordinal scale should not be subjected to mathematical operations, as uninterruptible output results. The index cannot provide insights into the reasons behind inequality.
The Gini index is bogus.
These limitations do not curtail its use, such as when it provides a framework for assessing economic conditions, guiding policy decisions, or addressing social issues. Examples of incorrect use are:
Assessing Economic Conditions:
The assessment of income distribution using the Gini index produces a picture of how income is spread across different segments of a population. This aspect helps in identifying disparities that may exist.
Evaluation of Policies:
Evaluating policies using the Gini index helps assess the effectiveness of initiatives aimed at reducing inequality. Policymakers can see how changes in taxation or welfare programs influence inequality levels.
Evaluation of Social Issues:
The link between the index and social mobility provides insights into wealth distribution across generations. This practice permits the ability to position income inequality within the context of social change.
The above research frameworks appear valuable. Use of the index, however, invalidates all interpretation results. But that never stopped “experts” from expressing opinions reinforced by index research.
Here’s an illustration of how the Gini index is used invalidly. It makes this chart interesting from a political perspective:
Top Ten US cities ranked by Gini index value, 2021
| City | Party of Mayor |
| Washington D.C. | Democrat – included in this chart because index value higher than Miami’s |
| Miami, FL | Republican |
| New Orleans, LA | Democrat |
| Cincinnati, OH | Democrat |
| Atlanta, GA | Democrat |
| New York, NY | Democrat |
| Tampa, FL | Democrat |
| Houston, TX | Democrat |
| Boston, MA | Democrat |
| San Francisco, CA | Democrat |
| Chicago, IL | Democrat |
They all, except for Miami, have Democrat mayors. One reason (of five) for Miami’s high ranking is the influx of wealthier migrants and retirees that has led to concentrations of wealth in urban areas. Researchers and the MSM ignore this fact, cite only the Gini index as proof of inequality.
Research citing the Gini index should be discarded. Yet the vast majority of the US public, led by the MSM, accepts the “proof” afforded by the interpretation of the Gini index value.