


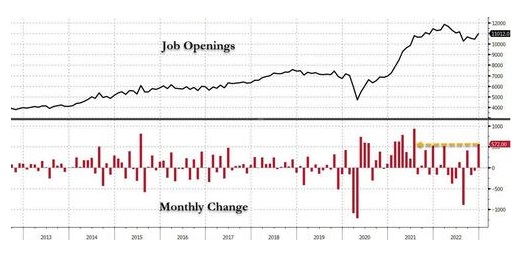
Job openings dropped modestly for the previous two months into the waning months of 2022, in December (recall JOLTS is one month lagged to the NFP report), and entirely out of the blue, job openings exploded by a massive 572K, the most since July 2021 when the US was indeed on a crazy hiring spree, and pushing total job openings to just above 11 million, the highest since July 2022. See this in the chart below and learn more here.
So is all well in the jobs market? Well, not so fast. Remember how the Biden administration has been gaming the job numbers.
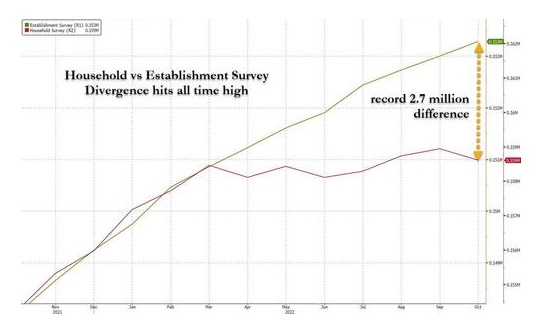
What has been perplexing is that despite the continued rise in nonfarm payrolls (the Establishment survey), the Household survey continues to telegraph growing weakness. As of Nov 30, the gap that opened in March has since grown to a whopping 2.7 million “workers” vs. the Establishment survey – see here the differences. One look at the chart below confirms all one needs to know about BLS “data integrity.” Basically, job growth has been flat since March.
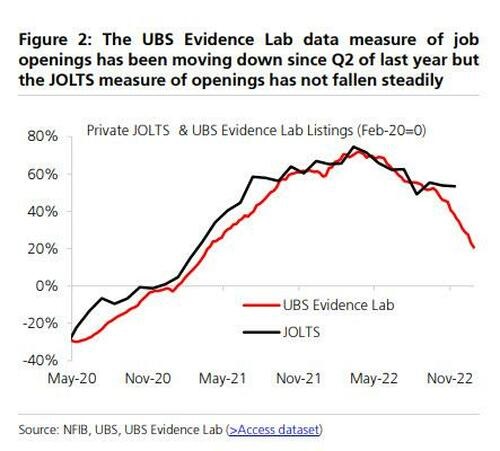
Back to the Job opening numbers. According to a UBS analyst, the job openings “data” collected and presented by Biden’s Department of Labor is, at best, wrong (and at worst, manipulated propaganda meant to make the labor market appear more robust than it is), and that the reality is far worse than the BLS suggests, with real openings down 30% from the March 2022 peak and only 25% higher than the 2019 average. See this divergence in the UBS and government numbers below.
Traditionally known as the “take this job and shove it” indicator as it reflects the confidence that a worker can find a better-paying job elsewhere (or else they wouldn’t quit voluntarily) – that attracted the attention of the WSJ’s Fed mouthpiece Nick Timiraos who specifically noted the drop in the quits rate to 2.9% from 3.0% in Nov and 3.3% a year ago. See his Tweet below.
Job openings rose to 11 million in Dec, sending the ratio of vacancies to unemployed workers up to 1.92 from 1.74 in Nov and 1.81 a year ago
— Nick Timiraos (@NickTimiraos) February 1, 2023
But private sector quit rate (a sign of churn) ticked down to 2.9% in Dec from 3% in Nov and 3.3% one year earlierhttps://t.co/dkVcGipsXE pic.twitter.com/KP96mns1to
These supposed great job numbers have given the Fed cover to continue their rate hike cycle to tame inflation. Hence, the Fed hiked 25bps as fully expected, and the statement had three key highlights:
- Hawkish – keeps “ongoing increases” (plural) language signaling no pause in March.
- Small Dovish – adds inflation “has eased somewhat” but notes “remains elevated.”
- Dovish – Changes “pace” of future increases with “extent” as it transitions from the rate of hikes to the duration of higher rates before any pivot.
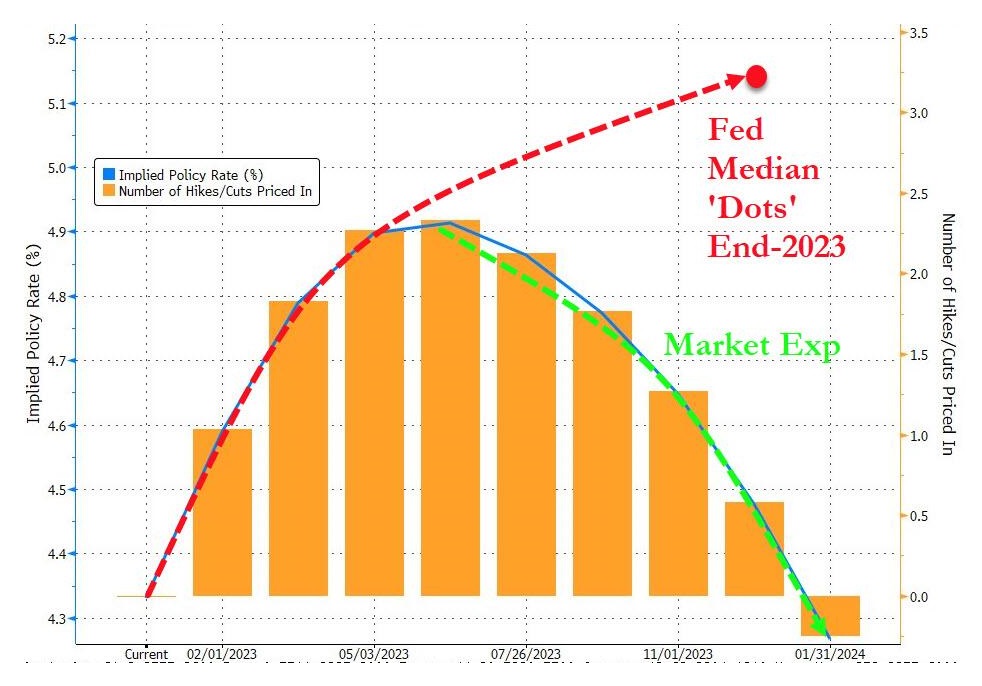
Fed Chair Powell will be jawboning any rate-trajectory expectations, which for now remains massively more hawkish than the market. See this divergence in the chart below.
We have never seen in recent history such enormous mistrust in government organizations. This would include the folks at the BLS and the Fed. So with the divergence in jobs and job opening numbers, why would we think it would be any different over at the Fed and the Markets?
They say never to fight the Fed regarding how they can manipulate markets. This may have been true in the past, but we are in new territory now. In the end, markets always show the truth and eventually win.
By Tom Williams


