


Data from Rambam hospital in Haifa reveal a stillbirth, miscarriage and abortion (SBMA) rate of 6% among women who never received a COVID-19 vaccine, compared to 8% among women who were vaccinated with at least one dose (and never had a SARS-Cov-2 infection).1
That’s a statistically significant odds ratio of 1.36 (CI 1.0-1.9), meaning your odds of having a stillbirth, abortion or miscarriage are 1.36 times higher if you are vaccinated.2
Another way of putting it is that the SBMA rate among vaccinated women was nearly 34% higher than the rate among unvaccinated women. This difference is statistically significant at the 95% confidence interval based on a Chi-square test of significance.
One possible explanation is that older women and women with co-morbidities were more likely to get vaccinated, and that explains the difference. It’s possible, but it has to be shown. This paper recently published in JAMA on live births based on Israeli electronic medical records shows that vaccinated and unvaccinated mothers were in many ways very similar. Vaccinated women were only about 1 year older on average than unvaccinated women in terms of average age (30.5 vs. 31.6 yrs) and if anything, the unvaccinated mothers were less healthy: more of them were obese and smoked; and they were far more likely to have had a SARS-Cov-2 infection during pregnancy.
But regardless of what reason for these differences is, the signal in these data are too strong and the issue too important to be dismissed with hand-waving arguments based on conjecture. That would be reckless.
We can get some purchase on the “unhealthy vaccinee” hypothesis by looking at the trend over time. If younger, healthier women were less likely to be vaccinated, then the differences across months should be fairly stable. But the differences are actually quite striking.
The bar chart below shows what percentage of births among vaccinated women were SBMA and what percentage were live births, and compares this to the percentage among unvaccinated women. (Vaccinated means the women had received at least one dose of the Pfizer/BioNTech COVID-19 vaccine.)3
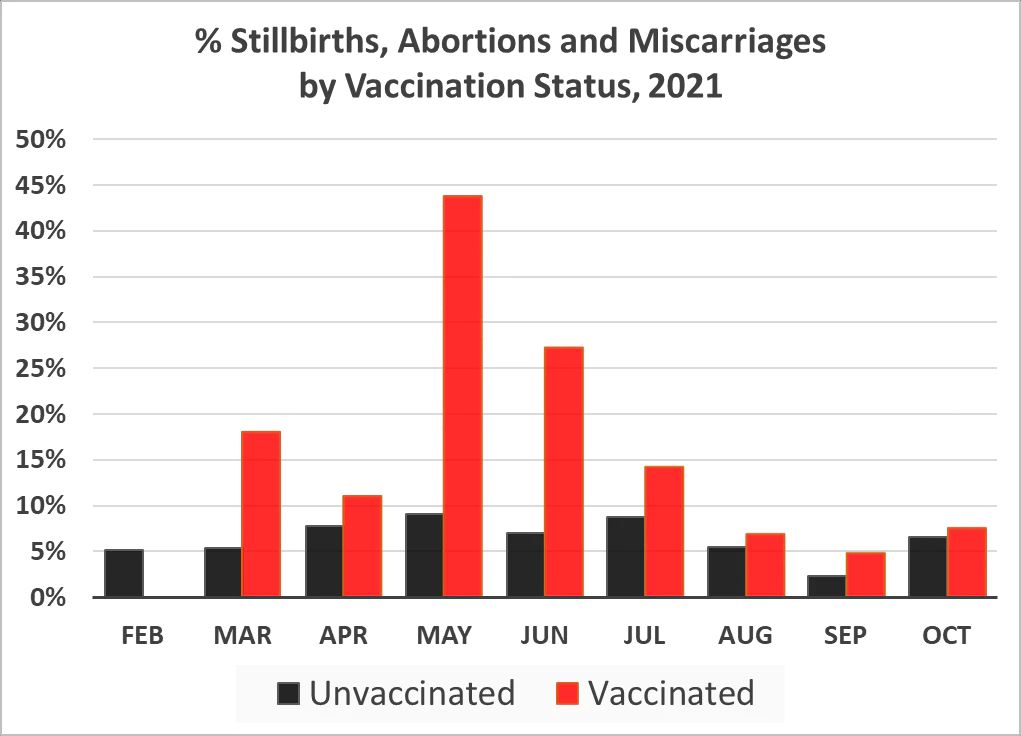
The SBMA rate among vaccinated women was higher than the rate among unvaccinated women for every month except for February, which was at the very beginning of the vaccination campaign for pregnant women when only 2 births were recorded for vaccinated women. Note this is counter to expectation if one assumes that the vaccines are supposed to protect people from COVID and Israel experienced a big COVID wave from delta from July-Sept.
The rate reached a peak in May, with 44% of vaccinated women experiencing a stillbirth, miscarriage or abortion that month, compared to 9% among unvaccinated women. In other words, of all the recorded pregnancy outcomes among vaccinated women in May, 43% were either stillbirth, miscarriage or abortion.
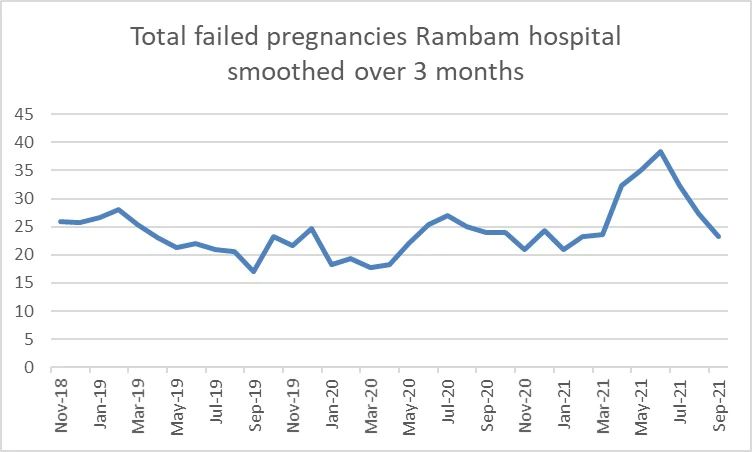
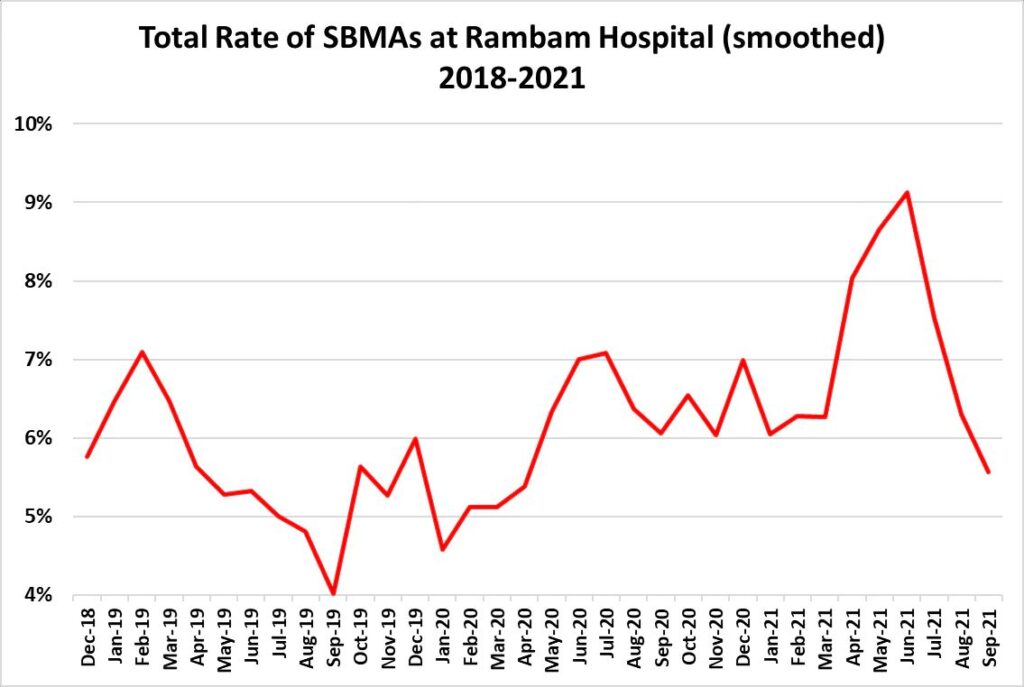
But if the difference is explained by older, less healthy pregnant women being more likely to get vaccinated, then we would expect the increase among the vaccinated to be offset by a decrease in the unvaccinated. But if we put the two groups together and look at trends over time, we still see a large increase:
Furthermore, if older, less healthy women were more likely to get vaccinated, then we would not expect to see this degree of variation over the year. If anything, we would expect to see the highest counts in Feb-April when women at higher risk for Corona would have been among the first in line to get vaccinated, according to this alternative explanations.
This is affirmed by data on vaccinations from the Israeli Ministry of Health. Below is a graph from the MoH showing vaccination rates from the beginning of the vaccination drive in December, 2020. Dark green is first dose, light green is second dose:
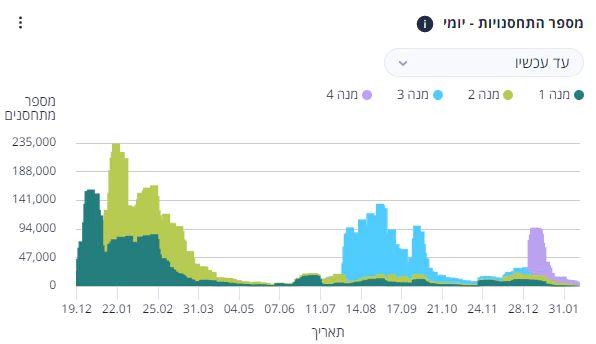
We can see that the overall vaccination rate began dropping precipitously in March and was very low in May. Furthermore, the differences in the SBMA rate between vaccinated and unvaccinated women for April, May and June are all statistically significant. In fact, the difference in May is likely to be observed by chance less than 1 in 100,000 times. (There was nothing special about May in terms of tight lockdowns or restrictions — in fact, the government started lifting restrictions and life was starting to get back to normal.) The other months would be statistically significant if the N was a bit larger. But alas, we only have data from one hospital.
Actually, that’s not entirely true. The activists who filed the FOIA request from Rambam also got information from another hospital, Sheba medical center. However, Sheba did not have information on vaccination status for a large number of women, so we can’t reliably compare vaccinated versus unvaccinated. But we can look at the SBMA rate this year compared to previous years, both for Sheba and Rambam. (Note that Sheba has a much higher baseline SBMA rate, for reasons that are not entirely clear. They serve very different populations, and Sheba may simply perform more elective abortions every year than Rambam.)
The graphs below show the SBMA rate at each hospital in 2019, 2020 and 2021 over 3 different time periods: January-October, March-October and April-June.
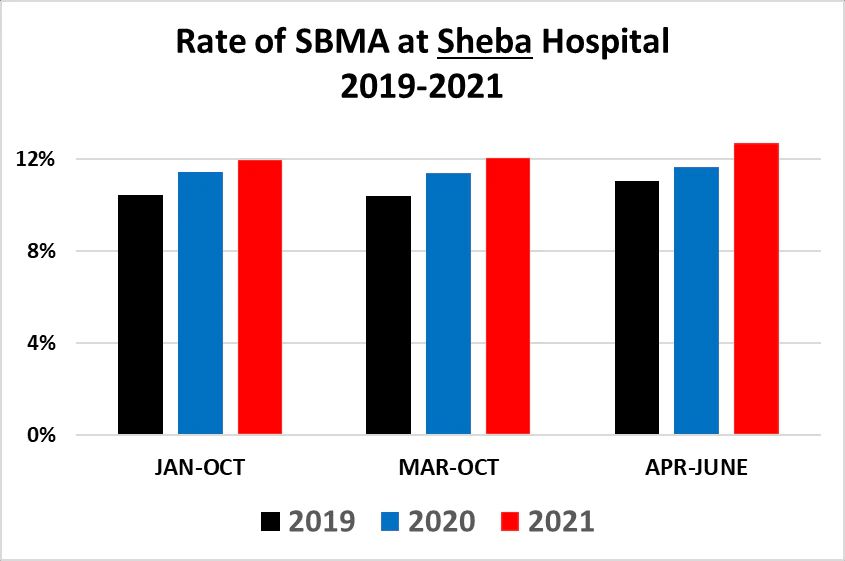
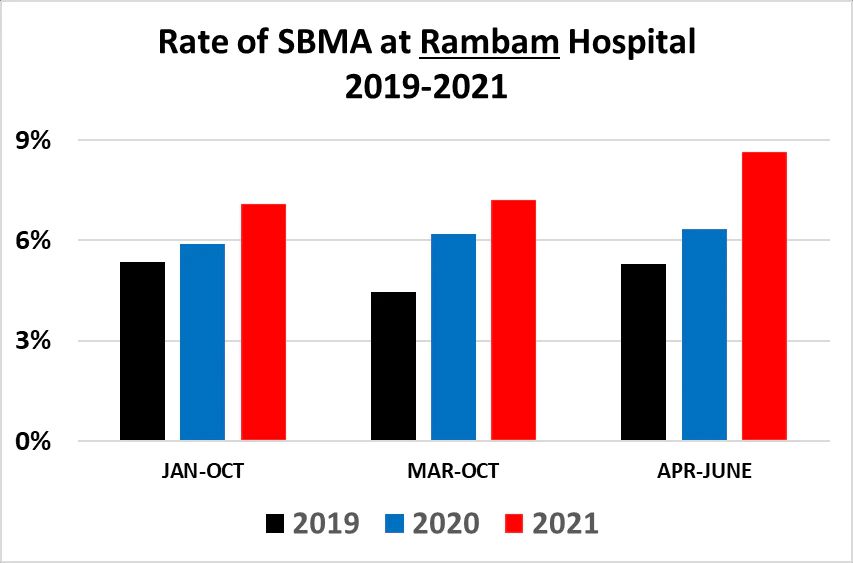
The SBMA rate is higher in both hospitals in 2021 compared to the previous years. Notably, April to June — which was the period with the highest (and statistically significant) rates of SBMA among the vaccinated at Rambam hospital — are also much higher at Sheba. At Rambam, the rate over that period is 8.7% versus an average of 5.7% for 2019-2020, which is 50% higher. At Sheba, the SBMA rate in 2021 for April-June is 12.7%, versus an average of 11.3% for 2019-2020, which is 12% higher.
In May, 2021, Rambam had 42 SBMAs, which was nearly double the average of the May total from the previous two years and 30% higher than the highest number of any month in the previous two years, which was 32 in June of 2020.
Sheba had its highest SBMA count in June, with 146. That was 30% higher than the average of the previous 2 years, and 11% higher than the largest number of SBMAs for any month in the previous 2 years, which was 132 in March, 2019.
And again: since these comparisons include both vaccinated and unvaccinated women, the difference cannot be due to older, less healthy women being vaccinated.
So to boil it down: in 2 different Israeli hospitals, 2021 has witnessed significantly higher rates of stillbirths, miscarriages and abortions than the previous two years, with some months setting a record for the number of SBMAs compared to 2019 and 2020. For the one hospital where we do have data comparing vaccinated to unvaccinated women, the rate of SBMAs among vaccinated women is 34% higher than among unvaccinated women.
I would be amiss not to discuss what the data say about women who had a SARS-CoV-2 infection during pregnancy. There were 7 such women who gave birth during this period, with 2 of them experiencing stillbirths or miscarriage. This is an odds-ratio of 6.2 (CI 1.2-32.3).
While this odds ratio is much higher than the ratio for vaccinated women, the percentage of all women in this hospital who had a SARS-CoV-2 infection during pregnancy was extremely low (0.17%), and so the overall risks of a miscarriage or stillbirth due to coronavirus infection are clearly outweighed by the risk to vaccinated pregnant women who have a 100% chance of being vaccinated — assuming vaccination is the driver of these differences. (There were 6 additional women who had COVID prior to pregnancy, all of whom had live births.)
In a sane world, this data would be Earth-shaking. The Israeli Ministry of Health would immediately stop vaccinating pregnant women against COVID-19 and launch a thorough investigation. Can we say for sure that vaccines are the cause of these patterns? No. Not with these data. But nobody can say for sure that the vaccines played no role. But the precautionary principle along with the oath to “First, do no harm” demand that action be taken. But since we don’t live in a sane world, that won’t happen. Instead the news will be greeted with quick, careless dismissals based on hand-waving arguments founded on assumptions and conjecture.
Addendum Feb 16, 2022:
In response to some questions and criticisms, I’ve been digging into the data a bit more. One of the concerns that was raised is that the total number of vaccinated women in the first half of the year is relatively small and only passes 100 in September. This suggests that pregnant women were not running out to get vaccinated. But it does raise the question of whether the vaccinated women in the first half of the year were much more likely to be in high-risk groups and that this explains the huge differences we see for example in May. I have several responses to this:
1. If that is the case then wouldn’t we see as high or higher rates in February, March and April?
2. There is a higher SBMA rate in every single month among the vaccinated than the unvaccinated, including during the deadly delta wave in Aug-Sep. This is totally contrary to expectation assuming the vaccines are highly protective against COVID morbidity and are extremely safe.
3. If we look at the overall SBMA rate, we see an increase. This can be seen in the second figure above, which shows the total number of SBMA’s. Below is a figure showing a similar graph for the SBMA rate, which looks very similar. Note that the rise from April-June is higher than the rate in April-June of 2019 at a level of statistical significance that says the difference is likely to be due to chance less about 1 in 1,000 times. (This graph and the ones below are smoothed using a 3-month rolling average in order to show the trend more clearly by dampening statistical noise.)
We can compare the trends in the overall rate from March to September for both Rambam and Sheba to see this. The charts below compare 2021 versus 2019. This comparison makes sense because 2020 was such an unusual year, and the first COVID wave hit Israel during these months (and even so as we saw above the values for 2021 are still higher than for 2020).
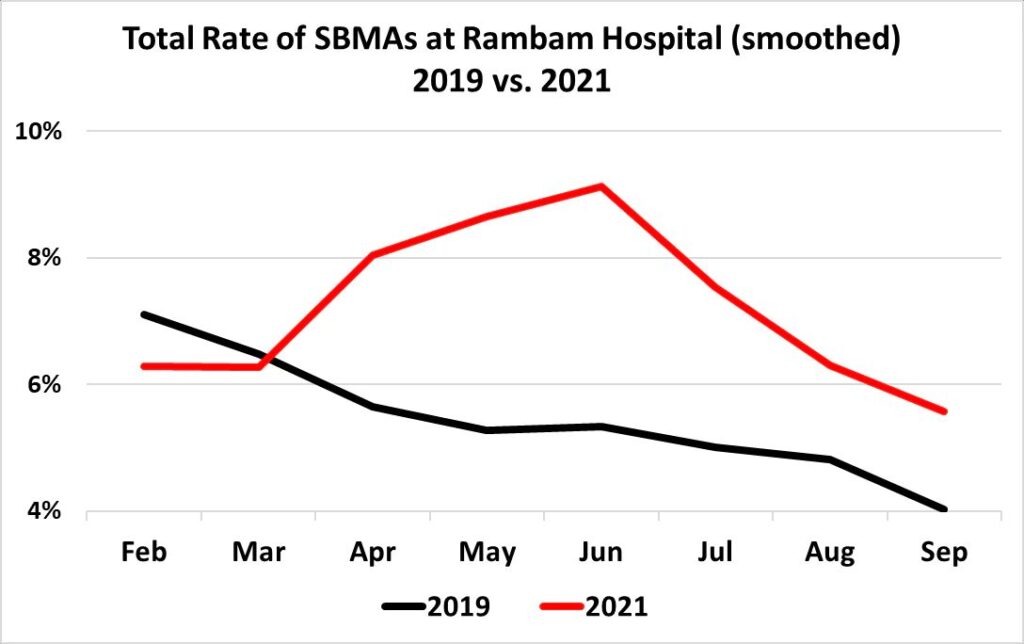
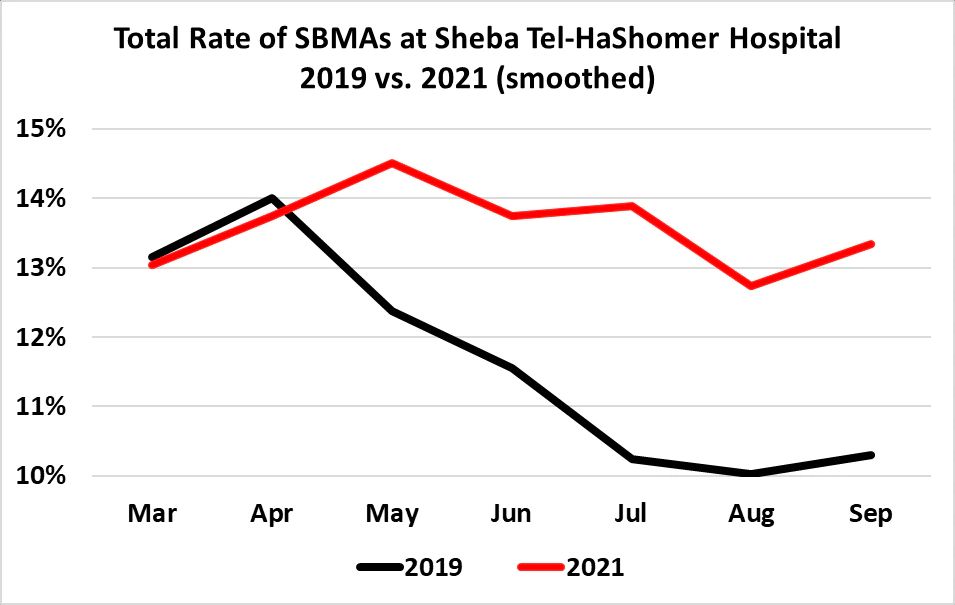
The graph for Rambam shows a noticeable increase over the 2019 numbers, beginning in April. The graph for Sheba shows a slight increase, but more notable is how the 2021 rate tracks closely with 2019 through March and then begins to diverge significantly from the 2019 rate beginning in April and stays elevated above the 2019 rate for the remainder of the year.
To reiterate: we cannot conclude from these data that vaccinations are the cause of these patterns, but whatever the cause, there is a concerning signal here that demands further investigation.
Addendum Feb 17:
A thought occurred to me as I was falling asleep last night: what would the overall SBMA rate look like if nobody was vaccinated? This type of thought experiment is known as a “counterfactual” and serves as the inspiration for quasi-experimental designs using observational data.
Of course I can’t do any kind of quasi-experimental analysis with these data and any such estimate would not be a true counterfactual. Still, I thought it could be a useful exercise to calculate the overall growth in the SBMA rate in Spring/Summer 2021 under the assumption that there were no vaccines and no vaccinated women and compare it to the overall rate that includes vaccinated women.
The graph below does that: the black line portrays the “counterfactual” SBMA rate without the vaccinated women (meaning vaccinated women with any birth outcome were simply dropped from the calculation); the red line shows the actual overall SBMA rate that includes the vaccinated women.
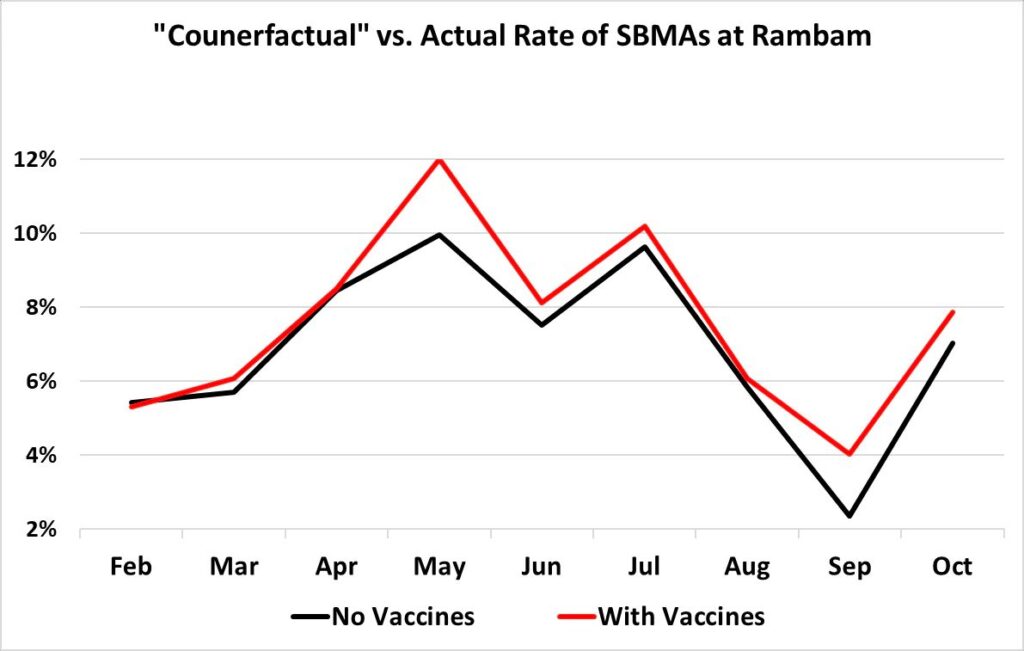
I put “counterfactual” in quotes in the title to emphasize that this is not a true counterfactual, because the women who got vaccinated are different from those who did in ways we can’t control for with these data. So for example, if the women who didn’t get vaccinated in the early period were healthier on average, then the “counterfactual” SBMA rate (black line) as calculated here should be lower than the true rate, because the less healthy (who chose to get vaccinated) have been excluded from the calculation.
Nevertheless, the graphs show the divergence between the “counterfactual” and SBMA rate. The divergence between them is largest in May then drops to its lowest in August — but then increases in September, which is when the booster dose was rolled out to people under age 60, and pregnant women were encouraged to get boosted. In absolute terms, the divergence in May is largest at 2 percentage points (vs. 1.7 in September). But in relative terms, the divergence in September is larger: it is 170% larger versus 120% in May.
So it seems this was a useful exercise after all, as it points to a safety signal in September — the booster period — that was not apparent from the other analyses.
1 The data were provided to a concerned Israeli citizen who filed an FOIA request. I became aware of the existence of the data lawyer Ori Xabi and wealth coach and independent data analyst Oz Koren. The raw data provided by the hospitals is available here.
2 Note the data provided do not distinguish between stillbirths, miscarriages (sometimes referred to as spontaneous abortions) or late- or early-term abortions undertaken for medical or other reasons. Therefore we can only compare all of these together. It is possible that vaccinated women are more likely to voluntarily choose to terminate their pregnancies early. However, there is no a priori reason to think that vaccinated women would be more likely to do so than unvaccinated women, unless a congenital or other anomaly was discovered or the pregnancy put the woman at some kind of risk. There is also no reason why the percentage of vaccinated women seeking abortions would vary so greatly from month to month. Notice, too, the rate among unvaccinated women is far steadier over the period. Therefore, even if most of the difference between groups is due to voluntary abortions, it is still a worrying trend requiring further investigation.
3 In practice this means 2 or 3 doses, since only 8 of 669 vaccinated women were recorded as having only had 1 dose.


